The IROA Peaks and Envelopes
Learn how IROA isotopic envelopes and peak patterns enable accurate metabolite identification, formula assignment, and quantitation.

Unique Molecular Signatures for Accurate Identification & Quantitation
We have created internal standards whereby both C12 and C13 isotopes are uniformly present at approximately 5% for one isotope and approximately 95% for the second isotope. The molecules labeled at 5%13C have a strongly enhanced M+1 and the molecules labeled at 95% 13C a strongly enhanced M-1, creating a mirror-image of one another (see Figure 1).
Using traditional comprehensive (>98%) labeling, the monoisotopic peak of most compounds can usually be detected even if its intensity is low, but the M+1/M-1 minor peaks are easily lost. Where the C13 is increased to 5% or 95%, the M+1 and M-1 peaks for a six-carbon molecule such as arginine in Figure 1 become significantly larger, namely 32% of the height of the monoisotopic peak. Whereas if the C13 is present at only 1.1%, the height of the M+1 is only approximately 6% of the height of monoisotopic peak.
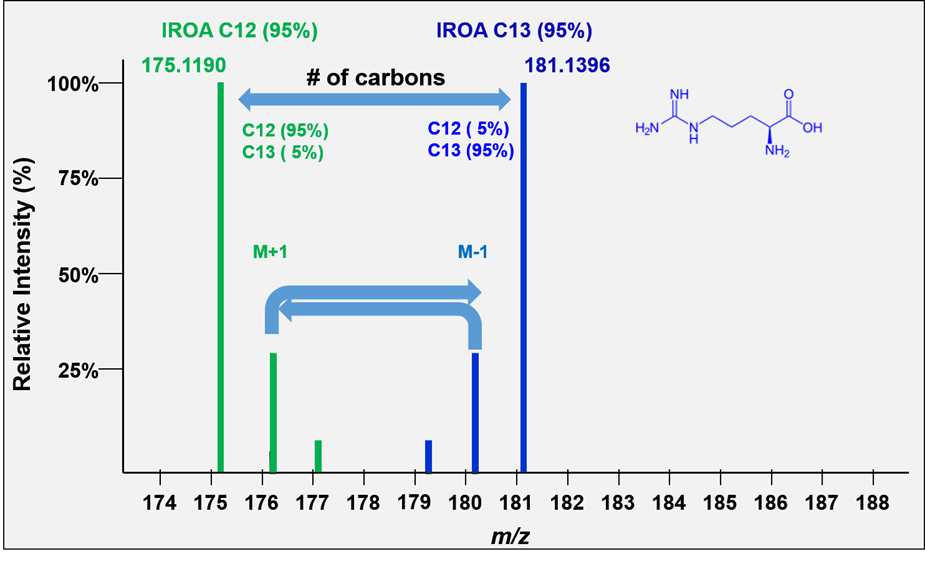
Figure 1. The IROA peaks. Molecule shown is the 6-carbon molecule arginine. Green: Arginine C12 envelope peaks labeled with U-5% 13C. Blue: Arginine C13 envelope peaks labeled with U-95% 13C.
A short tutorial on isotopomers and Isotopologs
- Isotopomers are molecules with the same number of isotopes (regardless of position). There are 5 isotopomers of glutamic acid (C5H9NO4) containing one 13

Therefore, all isotopologs have different masses and will appear in multiple Mass Spectral peaks. Furthermore, most isotopolog peaks likely contain multiple isotopomers. Every chemical formula has N+1 carbon isotopologs where N is the number of carbons in its formula, beginning with its C12 monoisotopic and ending with its C13 monoisotopic.
Therefore, all isotopomers have the same mass and will appear in a single Mass Spectral peak.
Isotopologs are molecules with the different numbers of isotopes. There are at least 6 isotopologs of glutamic acid, and aside from the first and last (the two monoisotopic isotopologs), they are not positionally defined.

Therefore, all isotopologs have different masses and will appear in multiple Mass Spectral peaks. Furthermore, most isotopolog peaks likely contain multiple isotopomers. Every chemical formula has N+1 carbon isotopologs where N is the number of carbons in its formula, beginning with its C12 monoisotopic and ending with its C13 monoisotopic.
The isotopolog ladder for all isomers of glutamic acid is shown in the Figure 2 below.
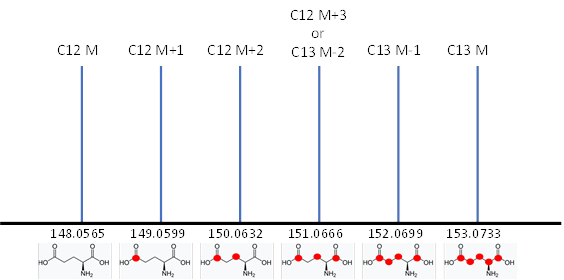
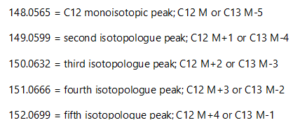
Figure 2. The Isotopomeric ladder for Glutamic acid (C11) as seen in RP pos LC-MS. Each isotopolog represents a specific mass by a molecular formula. In the case of carbon isotopologs, these are seen as a collected ladder of peaks extending from the C12 monoisotopic peak to the C13 monoisotopic peaks that differ in mass by 1.00335 amu. All molecules with six carbons will share this ladder but because each formula has a different mass each will begin and end at different masses. Therefore, each isotopolog ladder is unique to and representative of a single formula. (This is true for masses below 800, at a minimum.)
1) The isotopolog ladders for any formula are unique to that formula, but are common to all its isomers, e.g., Stereo, D/L, Structural, etc. However, the shape of the isotopolog peaks is defined by the relative percentages of the isotopes.
2) The Isotopomeric ladder for Glutamic acid is shared by all molecules that have the same formula (C5H9NO4), including Glutamic acid, O-Actetyl serine, Threo-3-methyl aspartate, and N-Carboxymethyl alanine.
3) It is the job of chromatography (LC, GC, etc.) to separate these, because techniques like Ion Mobility will not optimally do so.
Isotopolog Patterns Are Isotopic Envelopes
Figure 3 shows the isotopolog ladder for tryptophan, which contains an equal concentration of “molecules” (1:1) for the right and left side set of peaks; natural abundance on the left, 95% 13C on the right.
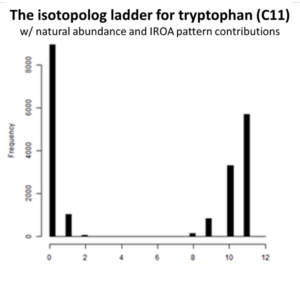
Figure 3. The Isotopomeric ladder for Tryptophan (C11).
The relative heights of each isotopolog peak in a ladder is determined by the isotopic balances of the source materials. The height of the peaks of isotopically defined compounds (enriched in a single element such as carbon) may be effectively calculated by the binomial expansion[1] of the expression (12C% + 13C%)N where N equals the number of carbons, and 12C% and 13C% equals the relative isotopic abundance.
In this image we see a situation common in IROA, namely a ladder that has the isotopic signatures contributed from two sources; the first source on the left is the natural abundance compound, and the second source labeled at 95% 13C on the right is its internal standard. These are presented at exactly equal concentrations of molecules from both sources however they are distributed very differently.
- Note that the height of the base peak is never indicative of concentration; rather the sum of all peaks from each collection must be considered.
- In the case of tryptophan, the base peak is still the C13 monoisotopic peak and represents only about half molecules in the internal standard.
- The base peak for an IROA compound with more than 20 carbons will no longer be the C13 monoisotopic peak. Instead, depending on the number of carbons, it will become one of the lower mass isotopologs.
This is because as the number of atoms in a molecule increases, the probability that the entire molecule contains at least one heavy isotope also increases.
For this reason we need to consider another new concept, the isotopic envelope.
[1] This is technically a polynomial expansion in which the dominance of carbon makes the remaining terms less important. See “Addressing the current bottlenecks of metabolomics: Isotopic Ratio Outlier Analysis, an Isotopic labeling technique for accurate biochemical profiling” page 7.
Isotopic Envelopes
All molecules with the same number of carbons will show the same pattern of peaks but will differ in the mass of their monoisotopic peaks according to the remainder of the formula. We refer to these peak height patterns as the peak “isotopic envelopes”. These envelopes are diagnostic for each formula.
The IROA carbon envelope shapes are readily and exactly calculable. The defining feature of the IROA carbon envelope is the mass of both monoisotopic peaks and the mass difference between them. The mass difference between the monoisotopic peaks is always a multiple of the mass of a neutron (~1.00335 amu). The additional peaks discussed above contribute to the extended isotopic envelope (M+2, M+3 etc., M-2, M-3 etc., see Figure 4) and the IROA ClusterFinder software can easily identify these peaks by their mass difference (the mass difference between a 13C and 12C isotope).
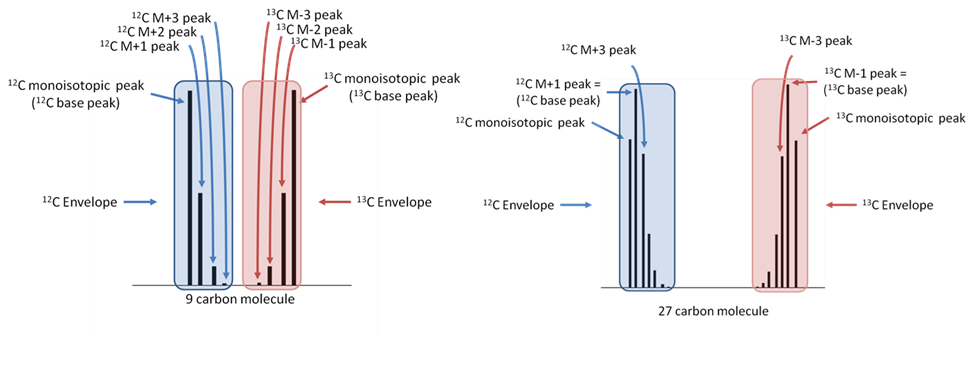
Figure 4. IROA isotopic envelopes (clusters) illustrating parts for a 9 carbon and 27 carbon molecule labeled with 5%13C:95%13C. Note the base peak shift. The monoisotopic peak for the 27-carbon molecule (right side of figure) is not the most abundant peak in the envelope.
- Isomers, isotopomers, and isotopolog patterns become complex very quickly. No two isotopologs are the same, and any isotopolog will generally contain more than one isotopomer and each contains different collections of isotopomers. We find this exact language to be useful however cumbersome.
- For IROA, we generally use two different isotopic distributions creating patterns that represent different isotopic balances, for example 1.1%13C:95%13C or 5%13C:95%13C. One of these, usually based on the C13 monoisotopic peak, will be the internal standard.
- For each formula all these isotopic patterns must use the same isotopolog ladders, but they will fill them differently.
- We believe it is easier to combine the embodiments of the isotopomers and isotopologues under the rubric of an “isotopic envelope”.
- There are two isotopic envelopes in any IROA sample.
Carbon is the only element that has an exact unit mass. This is because carbon is defined to be exactly 12.000000 amu. One outcome of this is that the exact unit masses of all other elements have slightly different “defects”, i.e., the fractional number beyond the decimal point. The mass “defect” is the difference between nominal mass (mass of the most abundant elemental isotope; for a molecule, the sum of the nominal masses of the constituent elements; i.e. H20=18) and the monoisotopic mass (exact mass) of an atom or molecule. These defects can only be added together a certain number of ways to get a specific mass as seen by a mass spectrometer.
Figure 5 shows an example of using mass defect to determine molecular formula. Using IROA we can calculate residual mass of all the other elements using both C12 and C13 base peaks. Since both the C12 and C13 base peaks share the same formula, the error on this residual value can be minimized by averaging the two residual masses.
With reasonably high-resolution mass MS (mass accuracy of 50 ppm or grater) and the knowledge of the number of carbons in a molecule (the distance between the C12 and C13 monoisotopic peaks), generally only one formula exists for molecules with masses below 500 amu. In the few cases where more than a single formula is possible, the use of mass defect residual tables can often resolve any ambiguity.
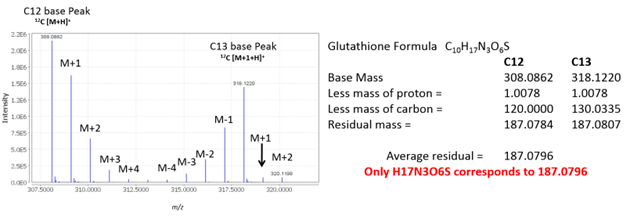
Figure 5. Calculation of average residual mass (mass defect) for glutathione.
Fundamental to the IROA concepts (and inherent in the name Isotopic Ratio Outlier Analysis) is the fact that the ratio of the C-12 envelope to the C-13 envelope is unaffected by suppression even though both the C-12 and C-13 isotopomeric sets may be strongly suppressed. This has afforded a mechanism for suppression correction that has been built into ClusterFinder. Once suppression is corrected, a Dual MSTUS[1] algorithm is employed to provide a very accurate mechanism for the normalization of samples against sample-to-sample variances. This version of ClusterFinder outputs three values: 1) the raw (suppressed) values observed; 2) a suppression-corrected value; and 3) a normalized (suppression-corrected and normalized) value.
Summary
- All isotopomers are isotopic isomers that share a single mass. There is no positional constraint.
- All isotopologs contain different numbers of isotopes but otherwise share a formula.
- In IROA there are always contributions from two different sources, usually an analyte and an internal standard. The peaks from both sources will superimpose onto the same ladder.
- An isotopolog ladder exists between the two monoisotopic peaks (from 2 different sources), and this ladder is diagnostic for the molecular formula that it is derived from.
- The collection of peaks donated by each source is grouped into a collection of isotopologs that is most easily identified as an isotopic envelope.
- Accurate quantitation requires summing all of the peaks in each envelope.
[1] Warrack BM, Hnatyshyn S, Ott KH, Reily MD, Sanders M, et al. (2009) “Normalization strategies for metabonomic analysis of urine samples.”, J Chromatogr B Analyt Technol Biomed Life Sci 877: 547–552.